Forex Signals & Market Insights: April 5- Intraday Focus
- forex368 Forex Education
- Apr 5, 2024
- 7 min read
Yen's Uplift Against USD: Influenced by BOJ Governor Ueda's remarks on possible interest rate hikes, leading to a 0.4% rise in the yen against the dollar.
BOJ Policy Shifts and Market Impact: Anticipation of rate hikes by BOJ, spurred by wage increases and inflation, boosts the yen.
Japanese Government's Intervention Stance: Suzuki’s readiness to address currency fluctuations strengthens the yen's position.
Safe-Haven Currency Demand: Geopolitical tensions, especially in the Middle East, drive investors towards the yen.
US Nonfarm Payrolls' Influence on USD: Strong NFP data could reinforce USD by indicating economic health and supporting Fed’s rate hikes.
Forex Market Volatility and NFP Data: The release of NFP figures can cause significant short-term movements in USD-related currency pairs.

Forex Trade Signals
EUR/USD GBP/USD USD/JPY USD/CHF NZD/USD AUD/USD USD/CAD EUR/GBP EUR/JPY EUR/CHF

Trading Signal for EUR/USD
Trade Direction: Sell
Entry Point: 1.0828
Take Profit: TP1: 1.0800, TP2: 1.0775
Stop Loss: 1.0850 (just above the daily pivot)
Confidence Level: Moderate
Indicator Analysis:
Bollinger Bands: Price is between the middle and lower band, indicating a potential downtrend continuation.
Ichimoku Cloud: Price is below the cloud, suggesting bearish momentum.
ATR: Recent increase indicates higher market volatility, justifying a wider stop loss.
MACD: The MACD line is below the signal line and histogram is declining, which supports a bearish outlook.
RSI: At 54.99, the RSI is neutral but slightly leaning towards overbought, which could mean there's room for a downward move.
Fundamental Analysis Insight:
Considering the strong USD due to recent positive economic data and anticipation of NFP figures later today, alongside the current market sentiment, there's a bearish bias on EUR/USD. The price being below the daily pivot point further supports this stance.
Trading Signal for GBP/USD
Trade Direction: Sell
Entry Point: 1.2625
Take Profit: TP1: 1.2600, TP2: 1.2575
Stop Loss: 1.2660 (slightly above the daily pivot)
Confidence Level: Moderate
Indicator Analysis:
Bollinger Bands: Price is near the middle band, suggesting a lack of a strong trend; however, the downtrend can resume.
Ichimoku Cloud: Price is below the cloud, indicating bearish momentum.
ATR: Elevated ATR suggests higher market volatility, caution is advised.
MACD: The MACD line is under the signal line, supporting a bearish bias.
RSI: Near 50, indicating a neutral stance but the downside potential remains.
Fundamental Analysis Insight:
The GBP is currently under pressure due to the recent economic calendar events and market sentiment. The price below the daily pivot point suggests that bearish sentiment is prevailing. Upcoming economic releases, including the NFP, should be monitored closely as they could introduce further volatility.
Trading Signal for USD/JPY
Trade Direction: Sell
Entry Point: 151.20
Take Profit: TP1: 151.00, TP2: 150.75
Stop Loss: 151.50 (just above the pivot and recent high)
Confidence Level: Moderate
Indicator Analysis:
Bollinger Bands: Price is approaching the middle band, indicating a potential for reversal or consolidation.
Ichimoku Cloud: Price is below the cloud, suggesting bearish momentum is present.
ATR: An increasing ATR indicates rising volatility, possibly favouring more pronounced moves.
MACD: The MACD line is below the signal line and is diverging, supporting a bearish move.
RSI: Hovering around the midpoint suggests indecision, but with bearish inclination given the price action below the pivot.
Fundamental Analysis Insight:
The yen has been gaining on the USD due to factors including BOJ’s potential shift in monetary policy. With the price below the pivot and given the recent decline, the bearish momentum might continue, especially with market volatility due to key economic releases such as NFP.
Trading Signal for USD/CHF
Trade Direction: Buy
Entry Point: 0.9025
Take Profit: TP1: 0.9040, TP2: 0.9060
Stop Loss: 0.9005 (below recent lows and psychological support)
Confidence Level: Low to Moderate
Indicator Analysis:
Bollinger Bands: The price near the middle band suggests that there could be room for an upward movement within the range.
Ichimoku Cloud: The price is at the cloud's edge, indicating potential for a breakout to the upside.
ATR: The current low ATR suggests a tighter range, which could mean smaller moves but also a potential quick bounce.
MACD: The MACD is flat and close to the zero line, but a slight positive divergence suggests a possible uptrend.
RSI: At 50, the RSI is neutral, supporting the potential for a move in either direction.
Fundamental Analysis Insight:
The slight buy recommendation is taken with caution due to the close proximity to the daily pivot point and mixed market signals. The USD/CHF pair's less volatile nature combined with upcoming NFP data may affect the strength of the USD, hence the moderate confidence level.
Trading Signal for NZD/USD
Trade Direction: Sell
Entry Point: 0.6009
Take Profit: TP1: 0.5990, TP2: 0.5965
Stop Loss: 0.6035 (above the daily pivot and recent high)
Confidence Level: Moderate
Indicator Analysis:
Bollinger Bands: Price nearing the lower band indicating that the market is potentially oversold and may be due for a reversal or pause in the downtrend.
Ichimoku Cloud: Price is currently below the cloud, which indicates a bearish sentiment.
ATR: Steady ATR indicates moderate market volatility, conducive for the continuation of the current trend.
MACD: The MACD line is below the signal line, although convergence suggests caution as a potential change in trend could be imminent.
RSI: At approximately 53, the RSI is in the middle but leaning towards overbought territory, suggesting some downward potential.
Fundamental Analysis Insight:
The NZD has been underperforming against the USD, as indicated by the price below the pivot. However, given the proximity to the pivot point and the potential for market reaction to NFP data, caution is advised as reversals may occur.
Trading Signal for AUD/USD
Trade Direction: Sell
Entry Point: 0.6573
Take Profit: TP1: 0.6550, TP2: 0.6520
Stop Loss: 0.6600 (above the daily pivot and psychological level)
Confidence Level: Moderate
Indicator Analysis:
Bollinger Bands: The price is moving towards the lower band, suggesting the possibility of a continuing downtrend or a bounce back as the price might become oversold.
Ichimoku Cloud: Currently, the price is below the cloud, indicating bearish momentum.
ATR: The ATR is at a moderate level, implying a reasonable expectation of volatility and the potential for the price to move towards the take profit levels.
MACD: The MACD line is below the signal line, which supports a bearish trend continuation.
RSI: At just above 50, it indicates some bearish potential, though it is close to neutral.
Fundamental Analysis Insight:
With the Australian dollar being below the pivot against the US dollar and given the current market dynamics, the selling pressure might continue. However, as the NFP data could impact USD pairs significantly, the level of confidence is moderate and positions should be managed actively.
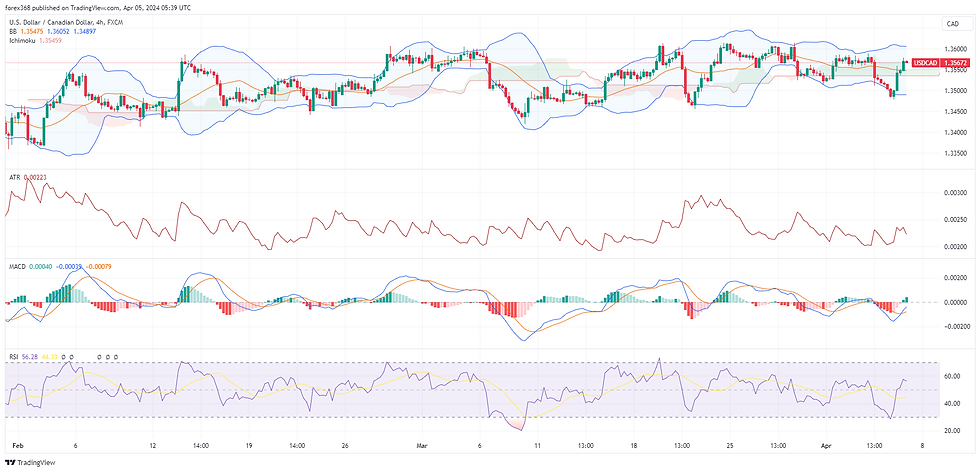
Trading Signal for USD/CAD
Trade Direction: Buy
Entry Point: 1.3567
Take Profit: TP1: 1.3585, TP2: 1.3605
Stop Loss: 1.3515 (below the daily pivot and recent swing low)
Confidence Level: Moderate
Indicator Analysis:
Bollinger Bands: Price is closer to the upper band, suggesting that the market may be reaching overbought levels, however, it still shows potential for an upward trend.
Ichimoku Cloud: The price is above the cloud, indicating bullish momentum.
ATR: The ATR is trending upwards, signifying increasing market volatility and the possibility of a stronger trend.
MACD: The MACD line is above the signal line but starting to converge, which means we might see momentum waning—a signal to monitor closely.
RSI: At around 56, the RSI suggests the market is neither overbought nor oversold, giving room for potential upside.
Fundamental Analysis Insight:
USD/CAD's current position above the pivot point is a sign of bullishness, potentially strengthened by the US's recent positive economic figures. However, with employment data due today, this could change swiftly, thus warranting a moderate confidence level.
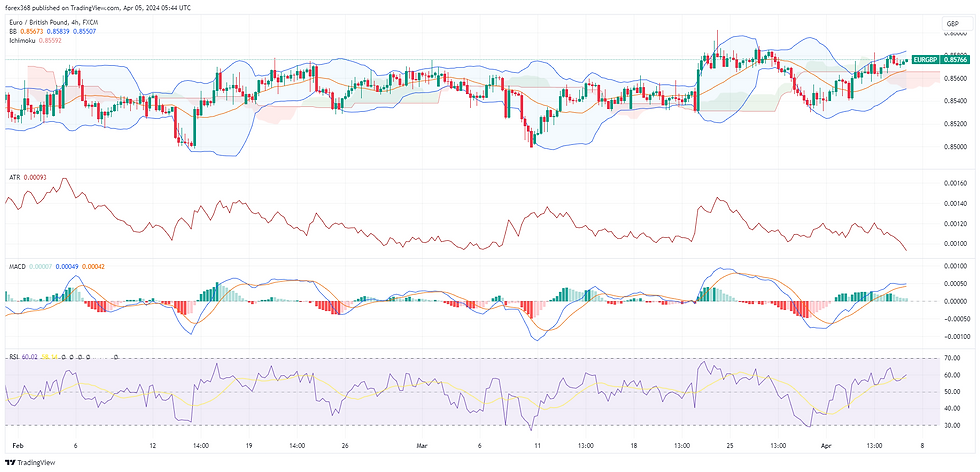
Trading Signal for EUR/GBP
Trade Direction: Buy
Entry Point: 0.8576
Take Profit: TP1: 0.8590, TP2: 0.8610
Stop Loss: 0.8550 (below the daily pivot and a recent support level)
Confidence Level: Moderate
Indicator Analysis:
Bollinger Bands: The price is trending towards the upper band, indicating a potential continuation of the current uptrend.
Ichimoku Cloud: Price is above the cloud, suggesting bullish momentum.
ATR: The ATR is showing modest volatility, which may support a move towards the profit targets.
MACD: The MACD line is above the signal line and histogram is positive, supporting the bullish sentiment.
RSI: The RSI is just above 50, which suggests some upward potential without being overbought.
Fundamental Analysis Insight:
The EUR/GBP pair is slightly above the pivot point, indicating a bullish bias. However, given the often tight trading range of this pair and the impact of any economic news releases from the Eurozone and the UK, traders should proceed with caution.

Trading Signal for EUR/JPY
Trade Direction: Sell
Entry Point: 163.64
Take Profit: TP1: 163.40, TP2: 163.00
Stop Loss: 164.35 (just above the daily pivot and the psychological level of 164.00)
Confidence Level: Moderate
Indicator Analysis:
Bollinger Bands: Price is between the middle and lower band, indicating that there could be a continuation of the current downtrend.
Ichimoku Cloud: Price is currently below the cloud, suggesting a bearish momentum.
ATR: High ATR indicates increased market volatility, which could lead to larger price movements.
MACD: The MACD line is below the signal line and is diverging, which suggests that the downward momentum is increasing.
RSI: The RSI is just below 50, pointing to a slight bearish momentum.
Fundamental Analysis Insight:
The EUR/JPY pair is trading below the pivot point, which could indicate bearish pressure. Given the recent strength of the yen amid possible shifts in BOJ policy, the EUR may face downward pressure against the JPY. However, upcoming economic releases may impact volatility.

Trading Signal for EUR/CHF
Trade Direction: Sell
Entry Point: 0.9766
Take Profit: TP1: 0.9750, TP2: 0.9730
Stop Loss: 0.9805 (just above the daily pivot to provide some buffer)
Confidence Level: Moderate
Indicator Analysis:
Bollinger Bands: The price is slightly above the lower band indicating a continuation of the downtrend or a potential reversal.
Ichimoku Cloud: Price is below the cloud, suggesting bearish momentum.
ATR: Slightly elevated ATR indicates higher market volatility which may facilitate reaching the take profit levels.
MACD: The MACD line is below the signal line, further supporting the bearish sentiment.
RSI: The RSI is near 50 which indicates neither overbought nor oversold conditions, maintaining the potential for a downward movement.
Fundamental Analysis Insight:
The EUR is currently facing downward pressure against the CHF, indicated by the price being below the pivot point. Considering the volatility of the CHF as a safe-haven currency and the potential impact of market news, a cautious approach is advised despite the moderate confidence in the bearish trend.
Disclaimer: These Forex Trade Signals are based on the current charts and market conditions. Always conduct your own analysis and consider risk management strategies before entering any trade. Markets are dynamic, and conditions can change rapidly.
As with all investments, your capital is at risk. Investments can fall and rise and you may get back less than you invested.
The information provided does not constitute, in any way, a solicitation or inducement to buy or sell securities and similar products.
Forex signals, comments and analysis created and reflect the views forex368.com at any given time and are subject to change at any time. ©2024 by forex368.com.
Without Knowledge, Prepare for Failure!


