

Free Forex Trading Signals for Maximum Profit - Expert Insights and Daily Updates - May 14, 2024
- forex368 Forex Education
- May 14, 2024
- 11 min read
- Dollar (USD):
- Keep an eye on Fed Chair Jerome Powell's speech for potential volatility in USD pairs.
- U.S. PPI data at 1:30 PM could impact dollar strength; a higher than expected reading may bolster USD.
- Gold (XAU):
- Watch for fluctuations tied to U.S. inflation data releases and Fed commentary.
- Gold could see increased safe-haven demand if economic data underwhelms.
- Oil (Brent and WTI):
- OPEC report awaited; continuation of supply cuts may push prices higher.
- Monitor U.S. PPI data as an indicator of economic health, influencing oil demand projections.
- Economic Calendar:
- 3:30 PM USD: Core PPI m/m - essential for gauging inflationary pressures at the producer level.
- 5:00 PM USD: Speech by Fed Chair Powell - key for insights on future monetary policy directions.
Forex Trading Signals
EUR/USD GBP/USD USD/JPY USD/CHF NZD/USD AUD/USD USD/CAD EUR/GBP EUR/JPY EUR/CHF USD/SEK XAU/USD (Gold) WTI (CL-Oil) BRENT CRUDE (UKOUSD) BTC/USD


Trading Signal for EUR/USD
Trade Direction: Sell
Entry Point: 1.0786
Take Profit: TP1: 1.0765, TP2: 1.0740
Stop Loss: 1.0810 (slightly above today's high)
Confidence Level: Moderate
Indicator Analysis:
Bollinger Bands: The price is currently near the middle Bollinger band, suggesting some room for movement towards the lower band, supporting a bearish outlook.
Ichimoku Cloud: Price is below the Ichimoku cloud, indicating a bearish trend.
ATR (Average True Range): The ATR is showing a decrease, which might suggest lower volatility; however, the economic events today could increase volatility temporarily.
MACD (Moving Average Convergence Divergence): The MACD line is below the signal line and close to crossing, suggesting a potential downward momentum.
RSI (Relative Strength Index): RSI is around 57, suggesting that there might be some room left before reaching overbought territory, supporting a possible downtrend continuation.
Fundamental Analysis Insight: With significant USD economic events on the calendar, including Fed Chair Jerome Powell's speech and the Core PPI data, there could be increased volatility and potential strengthening of the USD if the outcomes are bullish for the dollar.

Trading Signal for GBP/USD
Trade Direction: Buy
Entry Point: 1.2558
Take Profit: TP1: 1.2570, TP2: 1.2590
Stop Loss: 1.2517 (just below today's low)
Confidence Level: Moderate
Indicator Analysis:
Bollinger Bands: The price is currently just above the middle Bollinger band, suggesting potential for an upward move towards the upper band.
Ichimoku Cloud: The price is slightly above the Ichimoku cloud, indicating a bullish signal as the price is above the cloud.
ATR (Average True Range): The ATR is trending higher, indicating increasing market volatility which could lead to larger price movements.
MACD (Moving Average Convergence Divergence): The MACD line is above the signal line but starting to converge, suggesting a weakening of the current bullish momentum but still in a positive trend.
RSI (Relative Strength Index): RSI is near the midline around 55, suggesting that there is room for upward movement without the asset being overbought.
Fundamental Analysis Insight: Despite the Claimant Count Change data already being released, other key USD events today, including Fed Chair Jerome Powell’s speech and the Core PPI data, could influence GBP/USD trading through USD movements. A stronger USD from positive economic data could limit the upside potential, while any negative USD data could support further bullish movement in GBP/USD.
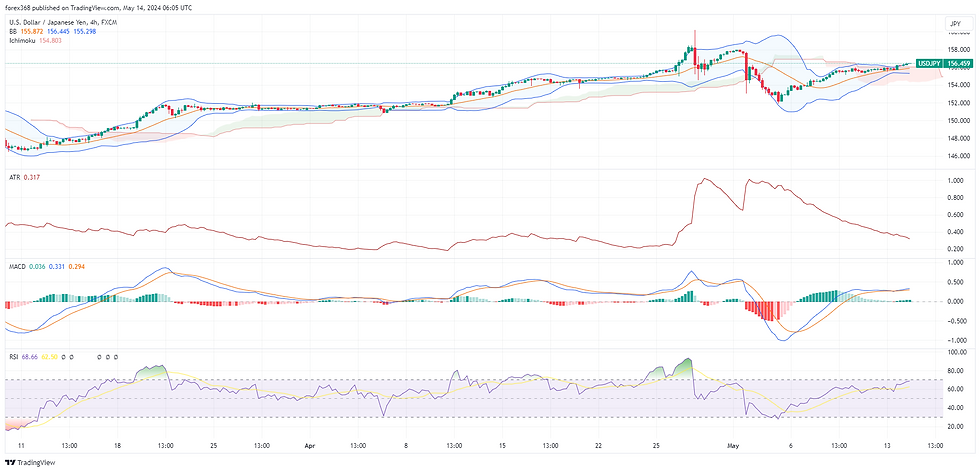
Trading Signal for USD/JPY
Trade Direction: Buy
Entry Point: 156.47
Take Profit: TP1: 156.80, TP2: 157.00
Stop Loss: 156.00 (just below the daily pivot)
Confidence Level: Moderate
Indicator Analysis:
Bollinger Bands: The price is operating near the middle band, suggesting moderate volatility. There's room for movement towards the upper band, which supports a bullish outlook.
Ichimoku Cloud: The price is above the Ichimoku cloud, which supports a bullish trend in the market.
ATR (Average True Range): ATR remains relatively high, indicating sustained market volatility and the potential for more significant price movements.
MACD (Moving Average Convergence Divergence): The MACD line is above the signal line and widening, which signals increasing bullish momentum.
RSI (Relative Strength Index): RSI is around 62, indicating some bullish momentum and not yet in the overbought territory, which supports further upward potential.
Fundamental Analysis Insight: Today’s key USD economic events, including Fed Chair Jerome Powell's speech and the Core PPI data, could cause fluctuations. A positive outlook from the Fed or higher-than-expected PPI might bolster USD strength, reinforcing the bullish signal for USD/JPY.
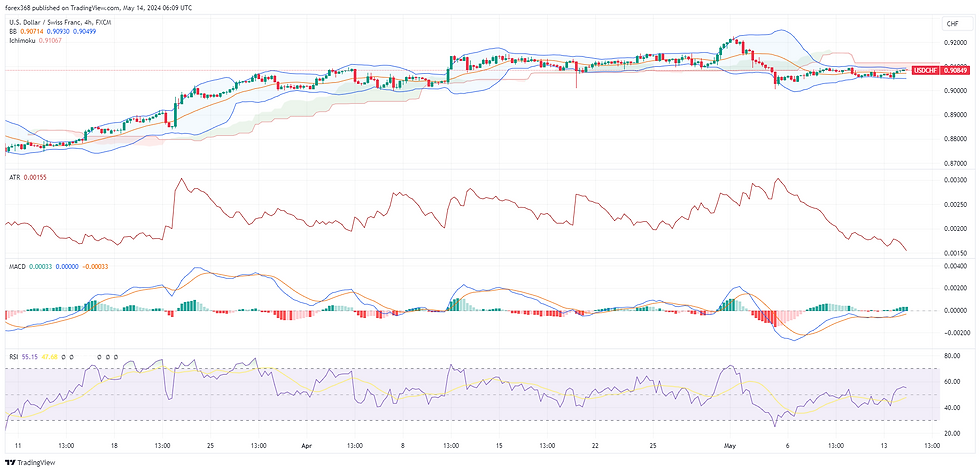
Trading Signal for USD/CHF (Buy Preference)
Trade Direction: Buy
Entry Point: 0.9085 (current price)
Take Profit: TP1: 0.9100, TP2: 0.9120
Stop Loss: 0.9065 (below the daily pivot and recent low)
Confidence Level: Low to Moderate
Indicator Analysis:
Bollinger Bands: Price near the middle band could consider an upward test toward the upper band if market sentiment improves.
Ichimoku Cloud: Currently at the cloud level, a decisive move above could confirm a bullish trend initiation.
ATR (Average True Range): Low ATR indicates smaller price moves, suggesting tighter stop losses and take profit targets might be appropriate.
MACD (Moving Average Convergence Divergence): Neutral position near zero, watch for a potential crossover above the signal line as a bullish confirmation.
RSI (Relative Strength Index): Mid-level RSI indicates neither overbought nor oversold, giving room for potential upside if market conditions favor USD.
Fundamental Analysis Insight: With key USD data releases ahead, including Fed Chair Jerome Powell’s speech and PPI data, positive outcomes could enhance USD strength, providing support for this buy strategy.

Trading Signal for NZD/USD
Trade Direction: Buy
Entry Point: 0.6018 (current price)
Take Profit: TP1: 0.6032 (recent high), TP2: 0.6050
Stop Loss: 0.6000 (below today's low)
Confidence Level: Moderate
Indicator Analysis:
Bollinger Bands: The price is hovering near the middle Bollinger band. With upward potential, the upper band could be targeted, supporting a bullish strategy.
Ichimoku Cloud: The price is right at the Ichimoku cloud, suggesting potential for bullish momentum if it firmly breaks above.
ATR (Average True Range): The ATR shows low volatility, which might limit the price movement but provides a clear range for setting tighter stop loss and take profit.
MACD (Moving Average Convergence Divergence): MACD is flat and around the zero line, indicating a lack of strong momentum but potential for an upward move if positive divergence develops.
RSI (Relative Strength Index): RSI is mid-range which allows room for price increase before reaching overbought levels.
Fundamental Analysis Insight: The NZD could react to shifts in market sentiment around USD movements, especially with the upcoming USD economic data releases. Positive USD data could pressure NZD/USD, whereas negative data could support a rise.
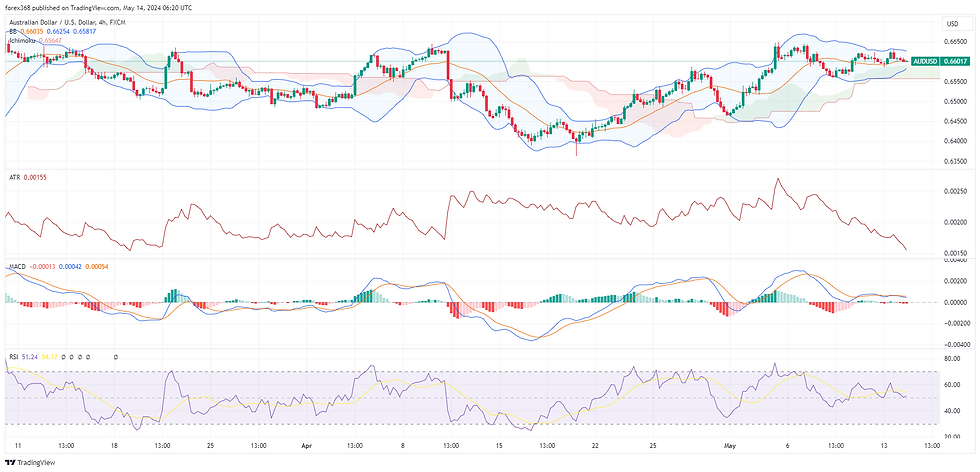
Trading Signal for AUD/USD
Trade Direction: Buy
Entry Point: 0.6601 (current price)
Take Profit: TP1: 0.6623 (today's high), TP2: 0.6650
Stop Loss: 0.6585 (below today's low)
Confidence Level: Moderate
Indicator Analysis:
Bollinger Bands: The current price is near the middle band, suggesting there's potential for movement towards the upper band.
Ichimoku Cloud: The price is slightly above the Ichimoku cloud, indicating a potential bullish trend.
ATR (Average True Range): The ATR shows moderate volatility, suitable for setting realistic stop loss and take profit levels.
MACD (Moving Average Convergence Divergence): The MACD line is near the signal line but slightly above, indicating a potential for bullish momentum.
RSI (Relative Strength Index): RSI is near the mid-range, suggesting there is room for the price to move up before reaching overbought conditions.
Fundamental Analysis Insight: Keep an eye on overall market sentiment and any USD-specific data releases, including economic indicators and Fed speeches. Positive data for the USD may dampen gains for AUD/USD, while weaker USD data can strengthen the pair.onomic data from Australia has been mixed, providing little support for a bullish stance on the AUD.

Trading Signal for USD/CAD
Trade Direction: Buy
Entry Point: 1.3676 (current price)
Take Profit: TP1: 1.3692 (today's high), TP2: 1.3720
Stop Loss: 1.3653 (just below today's low)
Confidence Level: Moderate
Indicator Analysis:
Bollinger Bands: The price is hovering around the middle Bollinger band, providing room for movement toward the upper band.
Ichimoku Cloud: The price is slightly above the Ichimoku cloud, suggesting bullish momentum.
ATR (Average True Range): ATR indicates moderate market volatility, supporting the potential for reasonable price movements.
MACD (Moving Average Convergence Divergence): The MACD line is close to the signal line, indicating potential for upward momentum if it crosses above.
RSI (Relative Strength Index): RSI is near 50, suggesting neither overbought nor oversold conditions, allowing room for an upward price movement.
Fundamental Analysis Insight: Monitor any economic data releases or geopolitical events that might impact the USD or CAD, including oil price fluctuations which can heavily influence the CAD. Positive news for the USD or negative for the CAD could further justify a bullish stance.

Trading Signal for EUR/GBP
Trade Direction: Buy
Entry Point: 0.8590 (current price, near daily pivot)
Take Profit: TP1: 0.8600, TP2: 0.8617 (today's high)
Stop Loss: 0.8580 (below recent low for safety)
Confidence Level: Moderate
Indicator Analysis:
Bollinger Bands: The price is currently near the lower Bollinger band, indicating a potential rebound towards the middle or upper band.
Ichimoku Cloud: The price is below the Ichimoku cloud, typically a bearish sign, but a buy strategy would hinge on a potential break back above the cloud.
ATR (Average True Range): Relatively low, which suggests less volatility and a tighter range of trading.
MACD (Moving Average Convergence Divergence): The MACD is close to the signal line, suggesting a lack of strong momentum but potential for a reversal if it crosses above the signal line.
RSI (Relative Strength Index): The RSI is near the middle, which doesn't indicate overbought or oversold conditions, providing room for potential upward movement.
Fundamental Analysis Insight: Monitor economic news from the Eurozone and the UK, as any significant reports could influence EUR/GBP. Positive news from the Eurozone or negative from the UK could support a bullish move.

Trading Signal for EUR/JPY
Trade Direction: Buy
Entry Point: 168.79 (current price)
Take Profit: TP1: 168.90, TP2: 169.00
Stop Loss: 168.50 (just below a recent minor support)
Confidence Level: High
Indicator Analysis:
Bollinger Bands: The price is currently above the middle Bollinger band, suggesting upward momentum toward the upper band.
Ichimoku Cloud: The price is above the Ichimoku cloud, indicating a strong bullish trend.
ATR (Average True Range): The ATR is relatively high, suggesting increased volatility and possibly larger price moves, which can benefit a bullish trade.
MACD (Moving Average Convergence Divergence): The MACD line is above the signal line, indicating bullish momentum.
RSI (Relative Strength Index): The RSI is nearing the overbought territory at around 70, which could signal strong buying pressure, but also suggests caution as it approaches 80.
Fundamental Analysis Insight: Keep an eye on economic releases from the Eurozone and Japan, especially any monetary policy announcements or economic performance data, as these can significantly impact the pair's movement.

Trading Signal for EUR/CHF
Trade Direction: Buy
Entry Point: 0.9793 (current price)
Take Profit: TP1: 0.9806 (today's high), TP2: 0.9820
Stop Loss: 0.9777 (below today's low)
Confidence Level: Moderate
Indicator Analysis:
Bollinger Bands: The price is currently near the upper Bollinger band, which might indicate a potential resistance area but also signals continued bullish momentum if it can break through.
Ichimoku Cloud: The price is above the Ichimoku cloud, reinforcing a bullish trend.
ATR (Average True Range): The ATR is moderate, indicating sufficient market volatility for meaningful price movements within this trading range.
MACD (Moving Average Convergence Divergence): The MACD is slightly above the signal line, which suggests bullish momentum.
RSI (Relative Strength Index): RSI is around 56, indicating some upward momentum without being in the overbought territory.
Fundamental Analysis Insight: Monitor the Eurozone economic data and Swiss economic indicators. Positive Eurozone data or negative Swiss news could further justify the bullish position.

Trading Signal for USD/SEK
Trade Direction: Buy
Entry Point: 10.8595 (current price)
Take Profit: TP1: 10.8683 (today's high), TP2: 10.8750
Stop Loss: 10.8425 (slightly below today's low for added protection)
Confidence Level: Moderate
Indicator Analysis:
Bollinger Bands: The price is currently near the upper Bollinger band, indicating a potential continuation of the bullish trend if momentum sustains.
Ichimoku Cloud: Price is above the Ichimoku cloud, confirming the prevailing bullish sentiment.
ATR (Average True Range): ATR indicates elevated volatility, supporting potentially larger price movements.
MACD (Moving Average Convergence Divergence): The MACD line is close to the signal line but above it, suggesting that bullish momentum might be building.
RSI (Relative Strength Index): RSI is near the mid-range, indicating neither overbought nor oversold conditions, which allows room for upward movement.
Fundamental Analysis Insight: Keep an eye on significant economic announcements from the US and Sweden, as these can affect currency volatility and direction. Strong US data could bolster USD, while weak data from Sweden could also push this pair higher.

Trading Signal for Gold (XAU/USD)
Trade Direction: Sell
Entry Point: $2338 (current price)
Take Profit: TP1: $2320, TP2: $2300
Stop Loss: $2350 (just above the recent high to protect against upward spikes)
Confidence Level: Moderate
Indicator Analysis:
Bollinger Bands: Although the price is near the middle Bollinger band, a push towards the lower band could indicate a successful sell strategy if bearish momentum builds.
Ichimoku Cloud: The price is above the Ichimoku Cloud, which typically suggests bullish conditions; however, any break below could signal a reversal and validate a sell.
ATR (Average True Range): High ATR indicates high market volatility, which could enhance the effectiveness of a sell strategy if market conditions turn bearish.
MACD (Moving Average Convergence Divergence): The MACD line is close to crossing below the signal line, a potential indication of decreasing bullish momentum.
RSI (Relative Strength Index): The RSI is approaching 60, not yet in overbought territory but nearing a level where reversals are possible.
Fundamental Analysis Insight: Monitor economic news closely, particularly those affecting the USD as increases in strength or interest rate adjustments can push gold prices down. Also, watch for sudden shifts in market sentiment or geopolitical events that could impact investor confidence in riskier assets.

Trading Signal for WTI Crude Oil (USOIL)
Trade Direction: Sell
Entry Point: $79.18 (current price)
Take Profit: TP1: $78.87 (daily pivot), TP2: $78.60 (today's low)
Stop Loss: $79.50 (above recent high for risk management)
Confidence Level: Moderate
Indicator Analysis:
Bollinger Bands: The price is trading near the middle Bollinger Band, which could support either direction, making a retest of the lower band plausible.
Ichimoku Cloud: The price is above the Ichimoku cloud, indicating bullish sentiment; however, any move below could suggest a trend reversal.
ATR (Average True Range): Indicates moderate volatility, suitable for short-term trades with tight stop-losses.
MACD (Moving Average Convergence Divergence): The MACD line is above the signal line but showing signs of converging, which might suggest potential bearish momentum if a crossover occurs.
RSI (Relative Strength Index): The RSI is around 50, which is neutral and does not strongly support either bulls or bears, allowing for potential downward moves.
Fundamental Analysis Insight: Monitor global oil supply reports, geopolitical tensions, and economic indicators that influence oil demand. Bearish news in these areas could support a sell position.s in supply from major producers could further depress prices, supporting a bearish outlook for WTI Crude.

Trading Signal for Brent Crude Oil (UKOUSD)
Trade Direction: Sell
Entry Point: $83.76 (current price)
Take Profit: TP1: $83.03 (daily pivot), TP2: $82.57 (recent low)
Stop Loss: $84.00 (just above recent highs for risk management)
Confidence Level: Moderate
Indicator Analysis:
Bollinger Bands: The price is between the middle and upper bands, suggesting it could move towards the lower band if bearish pressure increases.
Ichimoku Cloud: The price is just below the Ichimoku cloud, indicating that the market may be transitioning to a bearish phase or experiencing resistance.
ATR (Average True Range): The ATR shows moderate volatility, indicating that price movements are likely to be significant, which is good for short-selling strategies.
MACD (Moving Average Convergence Divergence): The MACD is near the signal line with the histogram bars shortening, which could indicate a slowdown in bullish momentum.
RSI (Relative Strength Index): The RSI is near the mid-level, suggesting neither overbought nor oversold conditions, providing room for a downward movement.
Fundamental Analysis Insight: Pay attention to global economic indicators, oil supply data, and geopolitical news that could influence oil prices. Negative shifts in these factors can drive prices down, supporting the sell strategy.

Trading Signal for Bitcoin (BTC/USD)
Trade Direction: Sell
Entry Point: $61,972 (current price)
Take Profit: TP1: $61,500, TP2: $61,000
Stop Loss: $62,500 (above recent high to mitigate risk)
Confidence Level: Moderate
Indicator Analysis:
Bollinger Bands: The price is trading near the upper middle region of the bands, suggesting potential retracement towards the lower band.
Ichimoku Cloud: The price is below the Ichimoku Cloud, indicating a bearish sentiment or a lack of strong bullish momentum.
ATR (Average True Range): Shows high volatility, which could enhance profit potential on quick price movements.
MACD (Moving Average Convergence Divergence): The MACD line is close to the signal line, suggesting that bearish momentum could be increasing if a crossover occurs below zero.
RSI (Relative Strength Index): The RSI is near the mid-line, indicating neutrality but leaving room for potential downward movement if bearish triggers appear.
Fundamental Analysis Insight: Stay updated on crypto market sentiment, news on regulatory developments, and major blockchain events. Negative news can quickly affect market prices and validate a bearish move.
Disclaimer: These Forex Trading Signals are based on the current charts and market conditions. Always conduct your own analysis and consider risk management strategies before entering any trade. Markets are dynamic, and conditions can change rapidly.
Forex & Commodities trading signals, comments and analysis created and reflect the views forex368.com at any given time and are subject to change at any time. ©2024 by forex368.com.